
The Real Story Behind the Sardis Housing Numbers: July 2026 Market Report
The Real Story Behind the Sardis Housing Numbers: July 2026 Market Report
by Justin Ott | Personal Real Estate Corporation
Oma's Favourite Realtor. Locally Grown. Professionally Driven.
If you're only reading the generic Fraser Valley and Chilliwack headlines, you're missing what's actually happening on the ground in Sardis. The July numbers tell a more layered story than "the market is up" or "the market is down" — because honestly, it's both, depending on which number you're looking at.
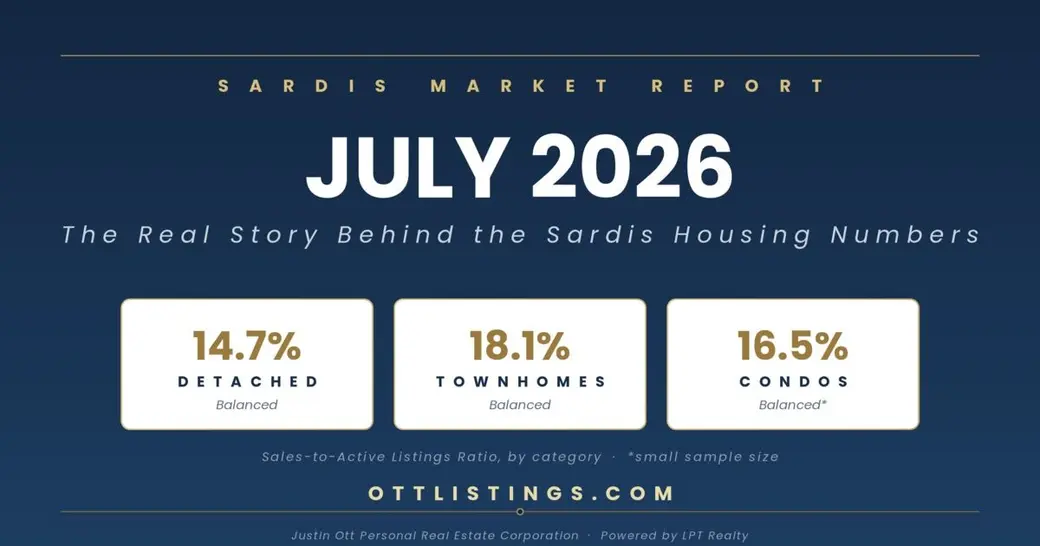
According to BCREA, market type is defined by the Sales-to-Active Listings Ratio (SALR): under 12% is a buyer's market, over 20% is a seller's market, and 12–20% is balanced. Sardis detached homes have sat inside that balanced band for all three periods we're comparing — but the ratio is sliding, and a couple of price signals are worth a closer look.
🏡 Detached Homes in Sardis: Balanced, But Cooling
- Sales: 35 homes sold, down 10.3% from June's 39, but still up 9.4% from July 2025's 32.
- New Listings: 84, down 3.4% month-over-month and down a sharp 19.2% year-over-year. Sellers are hanging back.
- Active Listings: 238, up slightly (+1.7%) from June, but still down 5.6% from a year ago.
- Median Price: $889,900, down 0.6% from June and down 4.0% year-over-year.
- Average Price: $965,660 — up 2.7% from June and up 6.2% year-over-year, even as the median slipped. That gap usually means a different mix of homes sold this month, not that every Sardis detached home gained value. The "typical" home (median) actually got a bit cheaper.
- The Ratio: SALR came in at 14.7%, down two points from June's 16.7%, but still above July 2025's 12.7%. Still balanced — but the trend line is pointing toward buyers.
📆 Buyers Are Taking Their Time
The number that jumped out most: median days on market hit 32 this July, up from just 19 in June and 26 a year ago. Homes aren't sitting for months, but they're no longer moving in under three weeks either. That's a real shift in pace from earlier this summer.
🏘️ Townhouses: Just Tipped Out of a Seller's Market
For over a year, Sardis townhouses have been a seller's game. That changed in July.
- Sales: 21 sold, down 16.0% from June's 25 and down 25.0% from July 2025's 28.
- New Listings: 51, up 15.9% month-over-month and up 13.3% year-over-year — more sellers testing the market just as buyer demand cooled.
- Active Listings: 116, up slightly (+1.8%) from June and up 5.5% from a year ago.
- Median Price: $575,000, down 3.4% from June and down 7.6% year-over-year.
- Average Price: $561,781, down 3.5% from June and down 11.7% year-over-year — this time median and average agree. Townhouse pricing is softening across the board, not just shifting in mix.
- The Ratio: SALR dropped to 18.1%, down from 21.9% in June and 25.5% a year ago. Both of those were seller's-market territory. July is the first month in a long stretch where Sardis townhouses have landed in balanced range instead.
📆 Days on Market Nearly Doubled
Median days to sell hit 43 in July, up from 26 in June and 23 a year ago. That's the fastest cooling signal in this report — homes that would have sold in three weeks a year ago are now taking closer to six.
🏢 Condos: Small Numbers, Big Swings — Read With Caution
Condos are the quietest of Sardis's three markets, and the smallest sample size means the numbers jump around more than they mean.
- Sales: 13 sold, flat from June's 13, but up 18.2% from July 2025's 11.
- New Listings: 18, down 33.3% from June and down 41.9% year-over-year — sellers are the ones sitting out this month, not buyers.
- Active Listings: 79, down 11.2% from June and down 3.7% from a year ago.
- Median Price: $435,000, up sharply (+23.2%) from June's $353,000 but down 4.4% year-over-year.
- Average Price: $530,000, essentially flat from June and up 12.1% year-over-year.
- The Ratio: SALR sits at 16.5%, up from 14.6% in June and 13.4% a year ago. Still balanced by BCREA's definition, but this is the only segment in Sardis trending upward, toward seller's territory rather than away from it.
📆 Days on Market: Take This One With a Grain of Salt
Median days to sell jumped to 60 in July, up from just 17 in both June and a year ago. With only 13 sales in the month, one or two slower-selling units can swing the median hard — this isn't necessarily a market-wide slowdown, just a reminder that condo data needs a longer look before drawing conclusions.
💡 Oma's Strategic Advice
Sellers: don't price to June's momentum — price to July's data. Buyers are willing to sell, listings are down, and homes are taking longer to find their buyer, which means overpricing now costs you more than it would have a month ago.
Buyers: the ratio is still balanced, not a firm buyer's market, so this isn't a fire sale. But with fewer new listings hitting the market and days on market stretching out, you've got a bit more room to negotiate than you did in June — especially on homes that have been sitting a while.
Whichever side of the transaction you're on, the average price headline doesn't tell the whole story. The median, the ratio, and the days on market do.
All stats above taken from the Fraser Valley Real Estate Board's July 2026 statistics package (InfoSparks, H70 – Sardis, Detached Houses).
Categories
Recent Posts





Oma’s Favourite Realtor. Locally Grown. Professionally Driven
GET MORE INFORMATION