
The Real Story Behind the Abbotsford Housing Numbers: July 2026 Market Report
The Real Story Behind the Abbotsford Housing Numbers: July 2026 Market Report
by Justin Ott | Personal Real Estate Corporation
Oma's Favourite Realtor. Locally Grown. Professionally Driven.
If you only read the broad, generic headline news about the Lower Mainland real estate market, you're missing the hyper-local reality happening right here in Abbotsford. The data for July 2026 shows three property types heading in noticeably different directions — and for the first time in a while, one of them has actually changed lanes.
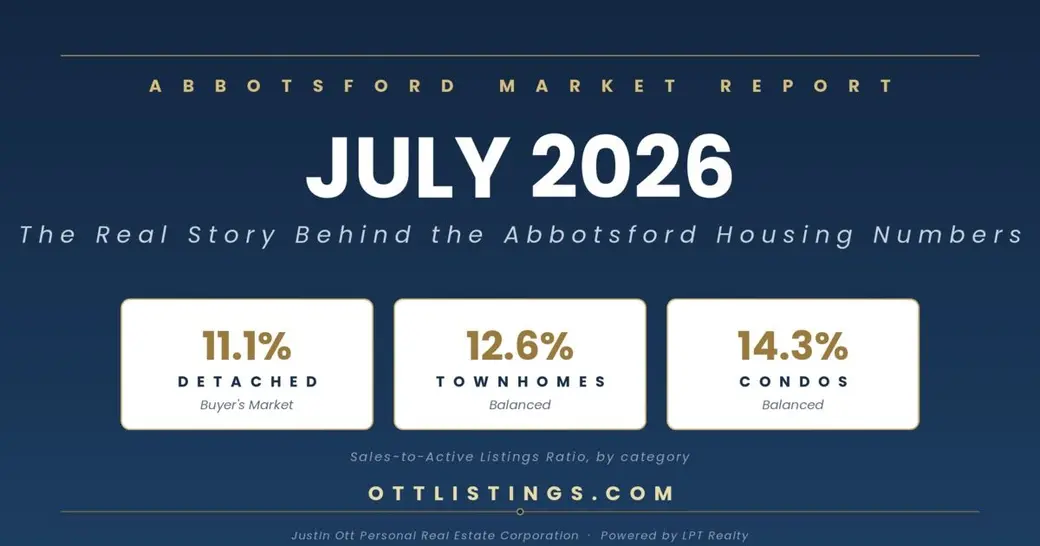
According to the British Columbia Real Estate Association (BCREA), market types are defined by the Sales-to-Active Listings Ratio (SALR). A ratio under 12% is a buyer's market, over 20% is a seller's market, and anything between 12% and 20% is a stable, balanced market.
Detached homes just crossed past that 12% line into buyer's-market territory. Townhouses and condos are still balanced, but both are cooling toward that same edge. Let's look at the hard data to see exactly where the opportunities hide.
🏡 Detached Homes: Into Buyer's-Market Territory
Every major detached number moved the same direction this month — down. This is the clearest shift of the three categories.
- Sales: 51 detached homes sold, down 19.0% from June's 63 and down 20.3% from July 2025's 64.
- New Listings: 145, down 15.7% month-over-month and down 18.5% year-over-year.
- Active Listings: 458, flat from June (0.0%) but down 10.5% from a year ago.
- Benchmark Price: $1,143,000, down 2.5% from June and down 7.6% year-over-year.
- Median Price: $1,050,000, up 1.0% from June but still down 9.1% year-over-year.
- Average Price: $1,066,910, down 9.2% from June and down 11.4% year-over-year.
- The Ratio: With sales pulling back while inventory held steady, the Sales-to-Active ratio fell to 11.1% — down from a balanced 13.8% in June. That's the line. Detached homes are now sitting in a buyer's market.
🏢 Townhouses: Holding the Balanced Line, Barely
Townhouses told a mixed story this month — pricing softened while the average sale price actually climbed, and the market cooled without quite tipping over.
- Sales: 34, down 15.0% from June's 40, but still up 6.3% from July 2025's 32.
- New Listings: 103, up 4.0% month-over-month and up 17.0% year-over-year.
- Active Listings: 269, up slightly (0.7%) from June and up 11.2% from a year ago.
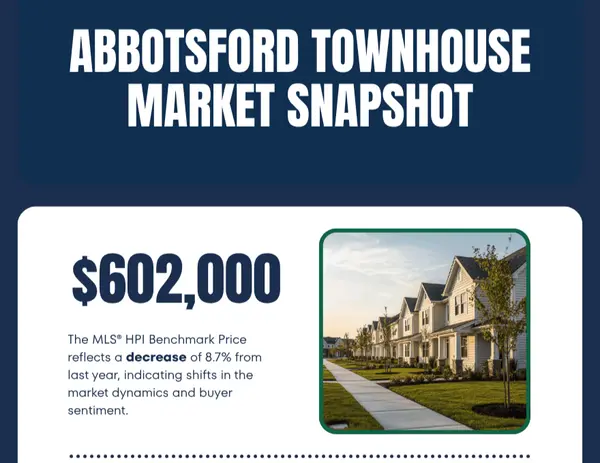
- Benchmark Price: $602,000, down 0.7% from June and down 8.7% year-over-year.
- Median Price: $633,750, down 1.7% from June and down 2.7% year-over-year.
- Average Price: $663,661 — the one number that went against the grain, up 5.7% from June and up 2.7% year-over-year, even as benchmark and median both slid. That kind of gap usually means a different mix of homes changed hands this month, not that every townhouse gained value.
- The Ratio: The Sales-to-Active ratio came in at approx 13%, down from 15.0% in June. Still balanced, but only just — this is the category to watch next month.
🏙️ Condos: Cooling, But Still the Steadiest of the Three
The apartment market pulled back across the board in July, most notably in new listings, which saw the sharpest drop of any category this month.
- Sales: 47, down 21.7% from June's 60 and down 19.0% from July 2025's 58.
- New Listings: 92 — the steepest decline in the report, down 28.1% month-over-month and down 43.6% year-over-year.
- Active Listings: 329, down 7.3% from June and down 14.1% year-over-year.
- Benchmark Price: $380,900, down 2.4% from June and down 9.9% year-over-year.
- Median Price: $390,000, unchanged from June (0.0%) but down 11.3% year-over-year.
- Average Price: $384,321, down 6.4% from June and down 18.7% year-over-year.
- The Ratio: The Sales-to-Active ratio sits at 14.3%, down from 16.9% in June. Condos remain in balanced territory and, for now, are the most stable of the three segments.
💡 Oma's Strategic Advice
This isn't one Abbotsford market — it's three, and July made that clearer than usual. Detached sellers are now working in a buyer's market for the first time in months, which means pricing to the current data matters more than ever, not pricing to what the house next door sold for last spring. Townhouse owners are sitting right on the edge between balanced and buyer-favoured, so timing a listing well is worth a real conversation before you pick a number. Condos are cooling too, but they're still the steadiest of the three — and with new listings pulling back hard, buyers who've been waiting on more selection may want to pay attention.
Whichever category you're in, the headline number on the news doesn't tell you what's happening on your street. The category-by-category numbers do.
All stats above taken from the Fraser Valley Real Estate Board's July 2026 statistics package.
Justin Ott | Personal Real Estate Corporation | Powered by LPT Realty
Locally Grown. Professionally Driven. | OttListings.com
Categories
Recent Posts



Oma’s Favourite Realtor. Locally Grown. Professionally Driven
GET MORE INFORMATION